


Treat truck insurance as an effective cost per kilometre, not a flat monthly bill, and you make better lane and fleet decisions. Divide your annual premium by your annual kilometres to get that figure. Mileage-based or on-demand pricing tends to help low-mileage, seasonal, or intermittent operations, but usually costs more for high-mileage, consistent long-haul work. This article shows the formula, benchmark ranges, a comparison of pricing models, and practical levers to bring your rate down.
TL;DR:
- Mileage-based insurance models benefit low-mileage or seasonal fleets by reducing costs through higher utilization of fixed premiums.
- Converting premiums into an effective annual cost per kilometer provides an accurate basis for comparing different coverage options and pricing models.
- High-mileage operators often pay less per km with fixed annual premiums, while on-demand or pay-per-mile policies suit fleets with irregular or variable usage.
- Telematics can lower insurance costs through safe-driving discounts but may increase premiums if driver behavior data indicates risk.
- Operators should analyze their specific mileage patterns and operational risks before choosing between fixed, mileage-based, or on-demand insurance structures.
Table of Contents
- How to calculate your per km truck insurance cost
- What do typical premium ranges look like in R/km?
- What drives your per km insurance cost the most?
- Pay-per-mile vs traditional fixed premiums: which wins?
- How to lower your effective R/km without cutting cover
- When on-demand cover actually lowers your R/km
- The math matters more than the marketing
- Get a per-trip quote if the numbers point that way
- Sources
- FAQ
How to calculate your per km truck insurance cost
The formula is straightforward: effective R/km = (annual premium + apportioned extras) ÷ annual paid kilometres. Apportioned extras include add-ons like goods-in-transit cover, trailer insurance, or machinery breakdown cover that you carry alongside your core policy.
Break the premium down by coverage line before you convert it, because each line behaves differently as mileage changes:
- Liability cover — largely fixed regardless of kilometres driven, so it dilutes fast as mileage rises.
- Cargo cover — often scales with load value and trip frequency, so higher mileage usually means higher exposure.
- Physical damage cover — tied to vehicle value and claims history, fairly stable year to year.
- Add ons (trailer, tools, goods-in-transit) — apportion only the share relevant to the trips you actually run.
Here is the worked example. If your annual premium across all lines remains constant, increasing your yearly kilometres reduces your effective cost per km. For instance, doubling your kilometres approximately halves the per-km cost, illustrating how fixed premiums reward volume by spreading the cost over more kilometres. The lesson: fixed premiums reward volume, because the cost gets spread over more kilometres. This is also why comparing annual versus on-demand cover matters before you commit to either model.
If you are leased-on to a carrier rather than running under your own authority, your out-of-pocket premium is usually far lower because the carrier supplies primary liability and cargo cover, and your own R/km calculation should only include what you personally pay, not the carrier’s side of the policy.
Converting between units is simple once you have annual figures: divide by 12 for a monthly R/km contribution, or multiply a monthly premium by 12 before dividing by annual kilometres. Keep the units consistent. Mixing monthly premiums with annual mileage is the most common spreadsheet error operators make when budgeting fleet costs.
What do typical premium ranges look like in R/km?
Owner-operators running a full coverage package often see annual premiums in the $9,000 to $17,000 range, and dividing that by annual mileage is how you get a usable per-km benchmark rather than a vague monthly number.
Pro Tip: Before comparing quotes, always convert every figure, yours and the insurer’s, into the same annual R/km basis. A cheaper monthly premium on a low-mileage truck can be more expensive per kilometre than a pricier premium on a high-mileage one.
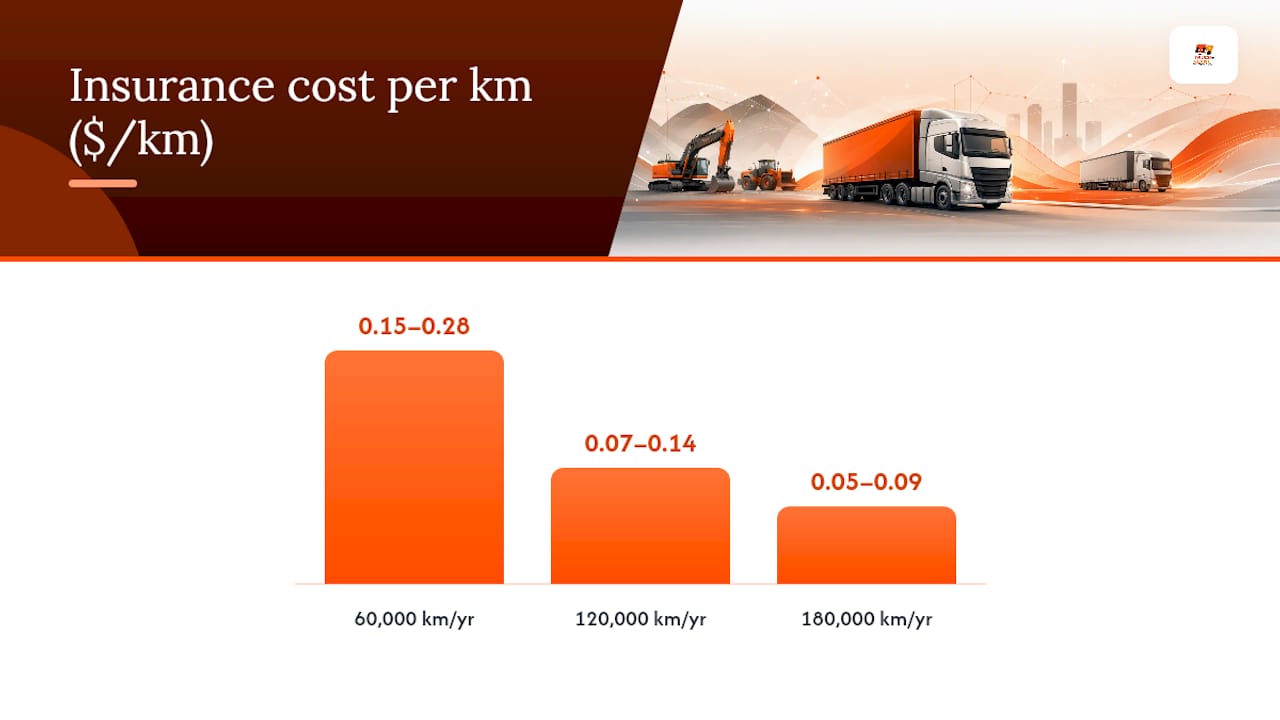
Converted across three mileage bands, the pattern looks like this:
- At 60,000 km/year (light regional or seasonal use), a mid-range premium sits toward the higher end of the per-km scale, since fixed costs are spread thin.
- At 120,000 km/year (typical medium-haul operation), the same premium roughly halves in per-km terms.
- At 180,000 km/year (heavy long-haul), the per-km cost drops further, often into the lower third of the range.
Industry benchmarks put insurance at roughly $0.10 per mile for many US fleet operations, a figure worth using as a sanity check even outside that market, since it confirms insurance behaves as a real, measurable line-item rather than a background cost.
Authority status changes the range meaningfully. Leased-on drivers typically pay substantially less out of pocket than own-authority operators, because the carrier’s master policy absorbs the bulk of liability and cargo risk. Specialty freight, hazardous materials, oversized loads, temperature-controlled cargo, pushes premiums above these general ranges regardless of mileage, because the underwriter is pricing exposure per load, not just distance.
What drives your per km insurance cost the most?
Mileage measures exposure, but insurers price the underlying risk factors more heavily than raw distance. Industry analysts note that cargo type, radius of operation, and driver history typically matter more to underwriters than the odometer reading alone.
The main levers that move your rate:
- Cargo class — general freight prices very differently from chemicals, livestock, or high-value electronics.
- Radius and lanes — tight regional routes usually underwrite cheaper than long interstate or cross-border corridors.
- Driver record — accident history and licence class changes pricing per driver, not just per vehicle.
- Garaging and security — a secured yard with monitored access reduces theft and vandalism risk versus street parking.
- Vehicle value and physical-damage needs — a newer, high-value tractor unit costs more to insure against damage than an older paid-off one.
- Night driving and corridor risk — routes with higher accident or hijacking rates carry a loading, especially on known high-risk corridors.
Telematics cuts both ways. Safe driving data, smooth braking, steady speeds, minimal harsh cornering, can earn real discounts. But the same data documents harsh braking, speeding, or long idle periods just as clearly, and insurers use it at renewal whether the picture helps or hurts you.
Pro Tip: If you install telematics purely to chase a discount, budget for driver coaching too. A device that only records bad habits without changing them can push your renewal premium up, not down.
Pay-per-mile vs traditional fixed premiums: which wins?
Reporting-style policies bill a base premium plus a per-kilometre rate, with monthly reporting and a true-up that reconciles what you were billed against what you actually drove. FreightWaves describes this mechanic as giving carriers real flexibility, but flexibility only pays off if your mileage genuinely fluctuates.
Before switching, check these program rules carefully:
- Minimum monthly bill — most programs charge a floor even in a month you barely drove.
- Device failure policy — find out what happens to your rate if the telematics device drops offline mid-month.
- Which coverages are mileage-rated — liability might scale with distance while cargo or physical damage stay fixed.
- Audit and penalty terms — late or inaccurate reporting can trigger retroactive adjustments.
Run the break-even math on two profiles. A seasonal operator doing 40,000 km a year with sharp swings between busy and quiet months often saves 20 to 40 percent by switching to a mileage-based structure, because they stop paying full fixed premium during idle stretches. A high-mileage long-haul operator running 180,000 km a year almost always comes out ahead on a traditional fixed premium, because the compounding per-km rate on a reporting-style policy adds up faster than a flat annual number spread over that same distance.
Late reporting is the real trap. If you miss a reporting deadline or under-report kilometres, the true-up invoice arrives retroactively and can land as a lump sum you did not budget for. Carriers switching to reporting-style cover should hold a contingency fund or negotiate payment terms before the first true-up cycle hits, rather than after.
How to lower your effective R/km without cutting cover
Start with operational fixes before touching your policy structure. Cutting deadhead kilometres, planning routes to avoid empty return legs, and scheduling maintenance to prevent unplanned downtime all raise your paid-km-to-total-km ratio, which improves your effective rate even if the premium itself does not change.
Risk management is the second lever.
- Install telematics and actually review the data monthly, not just at renewal time.
- Run active driver coaching sessions tied to the specific behaviours the data flags.
- Improve yard security and monitored parking to cut theft and vandalism claims.
- Enforce safe driving hours rather than pushing drivers into fatigue-risk shifts.
Pro Tip: Compare insurance programs on total effective annual R/km, not the headline cents-per-km rate. A low per-km figure with a high base premium and strict minimums can cost more than a plain fixed policy once you run the full math.
Commercially, look at your excess levels, bundling opportunities across trailer, goods-in-transit, and tool cover, and whether idle assets, a trailer that sits unused for months, would cost less under per-trip or on-demand cover than under a year-round fixed premium. Reviewing renewal steps before your policy date gives you leverage to negotiate rather than accepting the first renewal quote.
When on-demand cover actually lowers your R/km
On-demand cover aligns your premium to actual usage, which suits seasonal fleets, rental equipment, and plant hire assets that sit idle for weeks at a stretch. Instead of carrying a fixed premium year round, you pay when the asset is working. Truck & Plant On-Demand™ built its model around exactly this gap, tracking how flexible premium structures cut overhead for fleets with uneven usage. Run your own numbers through the worked example above, then check the per-trip costing page to see where your fleet lands.
The math matters more than the marketing
Most articles on this topic sell pay-per-mile as a universal upgrade over traditional premiums. It is not. The research is consistent on this point: mileage-based pricing helps operators with genuine volatility in their usage, seasonal fleets, rental equipment, plant hire assets that sit idle between jobs, and it tends to cost more for anyone running steady, high-volume long-haul kilometres month after month. Treating “usage-based” as automatically cheaper is the single biggest misconception in this space.
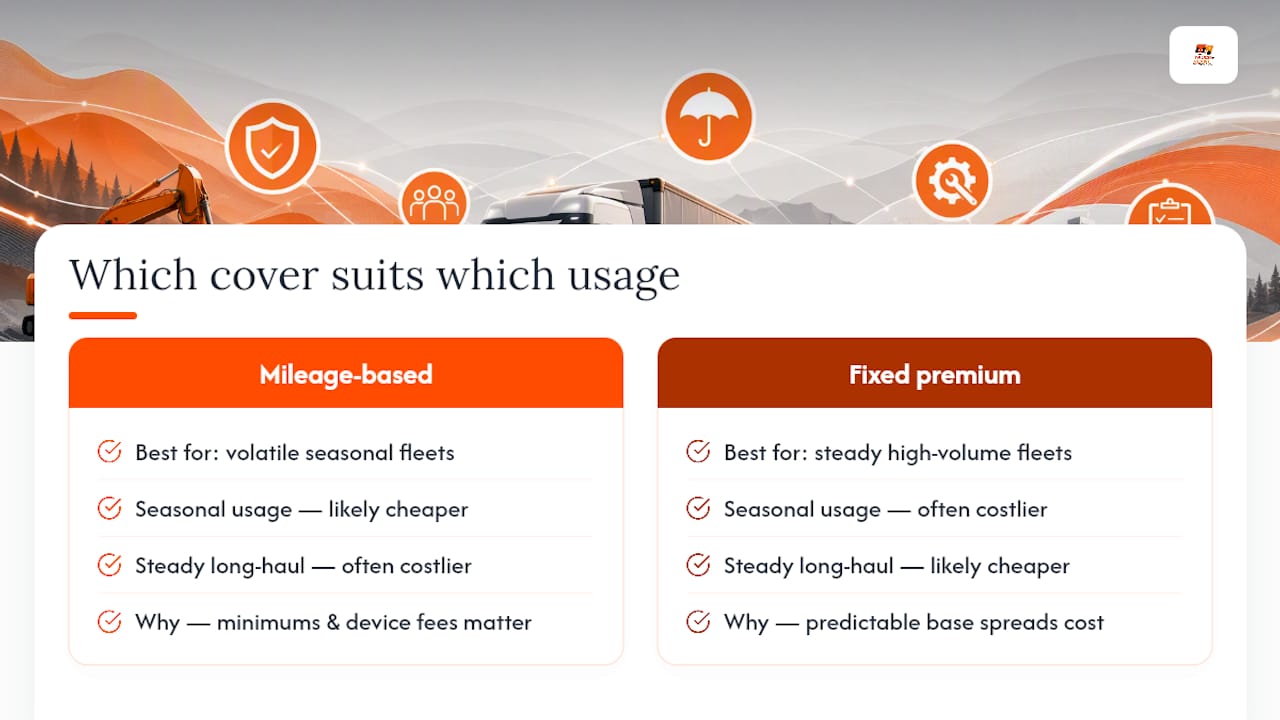
What conventional advice gets wrong is stopping at the headline cents-per-mile figure. That number means nothing without the base premium, the minimum monthly bill, and the device or program fees layered underneath it. Two policies quoting the same per-km rate can produce wildly different annual costs once you factor in a strict minimum charge.
If you take one thing from this guide, prioritise converting every quote, yours and the insurer’s, into a single effective annual R/km before you compare anything else. That discipline exposes which lanes are actually profitable once insurance is priced in, and it is the only honest way to decide between a fixed premium and a mileage-reporting structure.
— Coert
Get a per-trip quote if the numbers point that way
If your R/km calculation shows real seasonal swings, idle trailers, or plant assets sitting unused between jobs, fixed annual premiums are working against you. Truck & Plant On-Demand™ was built for exactly that pattern: pay only when the asset is on a job, adjust cover instantly as your operations shift, and skip the named-driver admin that slows down traditional policies.
This suits owner-operators with fluctuating mileage, plant hire businesses with seasonal machinery, and fleet operators carrying trailers or tools that do not work every day of the year. Run your fleet through the worked formula above, then compare the result against a per-trip quote to see which model actually wins for your kilometres. If trailers are part of your fleet, check trailer insurance options built on the same on-demand structure, or look at goods-in-transit cover if cargo exposure is your bigger cost driver. Start by requesting a quote through Truck & Plant On-Demand™ and compare it directly against your current effective R/km.
Sources
The benchmark ranges and pay-per-mile mechanics in this guide draw on FreightWaves’ reporting on mileage-based insurance, TruckMargin’s owner-operator cost calculator, LogRock’s pay-per-mile provider comparison, and Datatruck’s per-mile cost benchmarks. For hands-on next steps, read Truckplant’s guide to reducing fleet insurance premiums or work through the per-trip cost breakdown using your own mileage figures. To model fuel alongside insurance in your lane pricing, the diesel cost calculator is a useful companion tool.
This article is general information, not a substitute for advice from a qualified financial advisor. Consult a qualified financial professional about your own circumstances before acting on anything here.
- Insurance based on reported miles per month offers flexibility to carriers – FreightWaves
- TruckMargin — owner-operator truck insurance cost calculator
- Semi truck insurance cost what carriers pay in 2026 — Datatruck
FAQ
How much do trucking companies charge per km?
Freight rates per km vary by lane, cargo type, and fuel costs, and are separate from insurance cost per km, though both roll into your final rate calculation. Insurance is typically a smaller line-item within that per-km freight rate, closer to a few cents per km than a major cost driver on its own.
How much is truck insurance per month in South Africa?
Truckplant does not publish a fixed monthly rate, since on-demand premiums are quoted per trip or per usage period based on your specific vehicle, cargo, and cover needs. Current pricing is available by requesting a quote directly through Truckplant.
How much is insurance on a big truck?
Full coverage packages for owner-operators often fall in the $9,000 to $17,000 annual range, though cargo type, radius, and driver history push individual quotes well outside that band. Converting that figure into R/km using your own annual mileage gives a far more useful number than the raw annual premium.
How do you calculate cost per km for trucks?
Divide your annual premium, plus any apportioned add-on cover, by your annual paid kilometres to get effective R/km. Running the same premium across different mileage levels shows how quickly the per-km cost drops as distance rises, which is why fixed premiums favour high-mileage operators over low-mileage ones.
Does pay-per-mile insurance always cost less than a fixed premium?
No. It tends to save money for seasonal or low-mileage operators, sometimes 20 to 40 percent, but consistent high-mileage long-haul operations usually pay more under a reporting-style structure once the per-km rate compounds across the full year.